The Data Analysis Process: A Step-by-Step Guide
The process of data analysis is a systematic approach that involves several stages, each crucial to ensuring the accuracy and usefulness of the results. Here, we’ll walk you through each step, from defining objectives to data storytelling.Step 1: Defining objectives and questions
The first step in the data analysis process is to define the objectives and formulate clear, specific questions that your analysis aims to answer. This step is crucial as it sets the direction for the entire process. It involves understanding the problem or situation at hand, identifying the data needed to address it, and defining the metrics or indicators to measure the outcomes.
Step 2: Data collection
Once the objectives and questions are defined, the next step is to collect the relevant data. This can be done through various methods such as surveys, interviews, observations, or extracting from existing databases. The data collected can be quantitative (numerical) or qualitative (non-numerical), depending on the nature of the problem and the questions being asked.
Step 3: Data cleaning
Data cleaning, also known as data cleansing, is a critical step in the data analysis process. It involves checking the data for errors and inconsistencies, and correcting or removing them. This step ensures the quality and reliability of the data, which is crucial for obtaining accurate and meaningful results from the analysis.
Step 4: Data analysis
Once the data is cleaned, it’s time for the actual analysis. This involves applying statistical or mathematical techniques to the data to discover patterns, relationships, or trends. There are various tools and software available for this purpose, such as Python, R, Excel, and specialized software like SPSS and SAS.
Step 5: Data interpretation and visualization
After the data is analyzed, the next step is to interpret the results and visualize them in a way that is easy to understand. This could involve creating charts, graphs, or other visual representations of the data. Data visualization helps to make complex data more understandable and provides a clear picture of the findings.
Step 6: Data storytelling
The final step in the data analysis process is data storytelling. This involves presenting the findings of the analysis in a narrative form that is engaging and easy to understand. Data storytelling is crucial for communicating the results to non-technical audiences and for making data-driven decisions.
The Types of Data Analysis
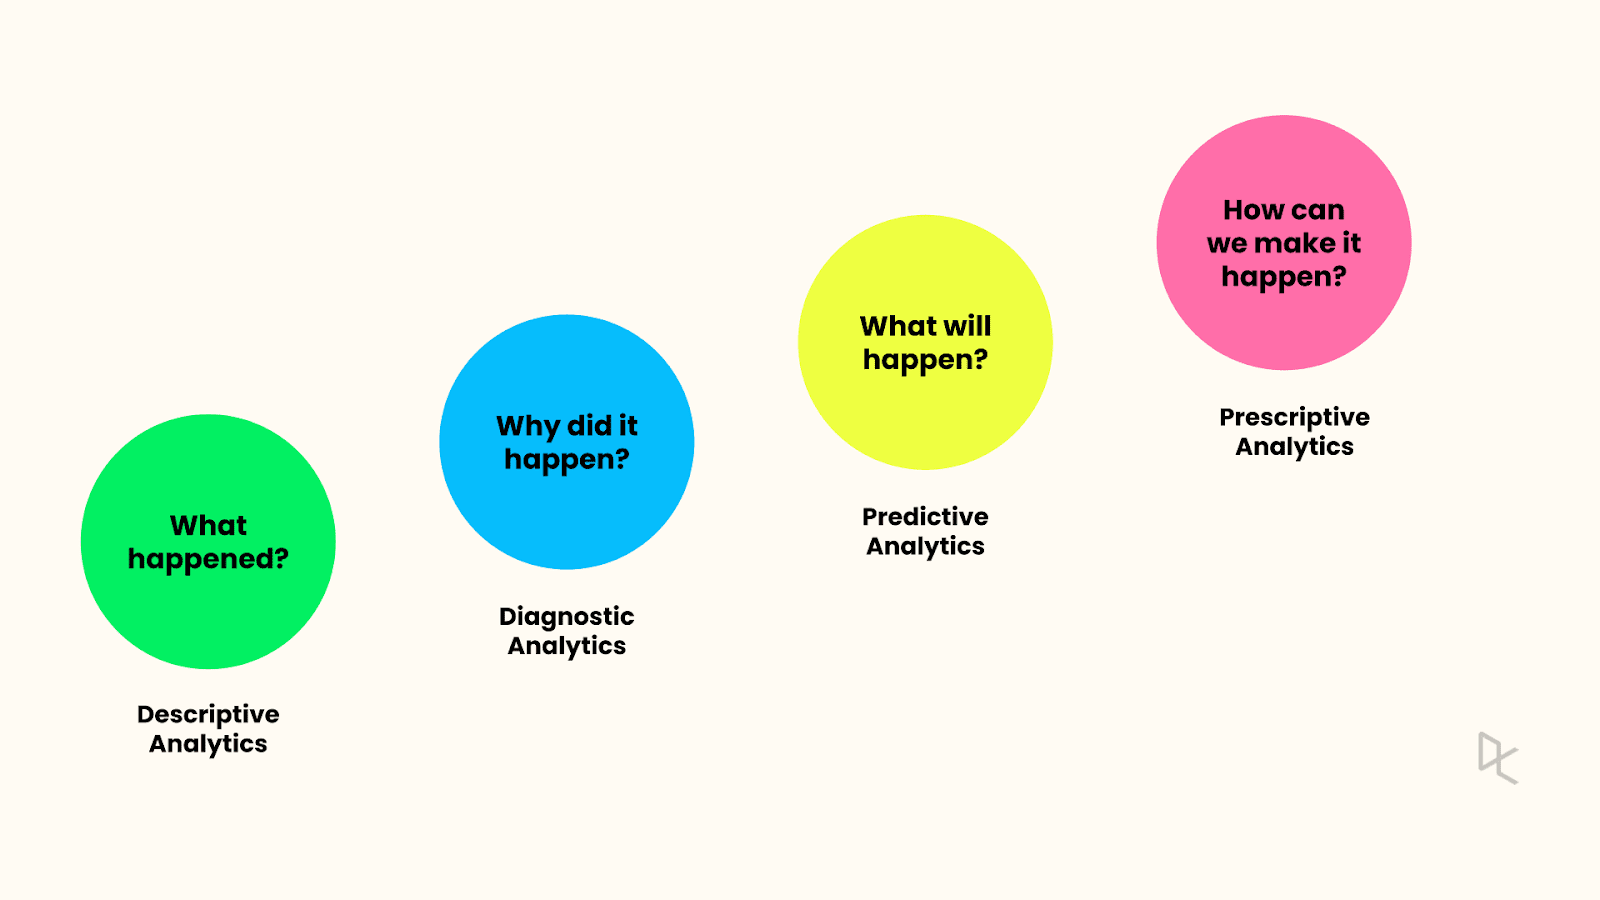
Data analysis can be categorized into four main types, each serving a unique purpose and providing different insights. These are descriptive, diagnostic, predictive, and prescriptive analyses.

Descriptive analysis
Descriptive analysis, as the name suggests, describes or summarizes raw data and makes it interpretable. It involves analyzing historical data to understand what has happened in the past.
This type of analysis is used to identify patterns and trends over time.
For example, a business might use descriptive analysis to understand the average monthly sales for the past year.
Diagnostic analysis
Diagnostic analysis goes a step further than descriptive analysis by determining why something happened. It involves more detailed data exploration and comparing different data sets to understand the cause of a particular outcome.
For instance, if a company’s sales dropped in a particular month, diagnostic analysis could be used to find out why.
Predictive analysis
Predictive analysis uses statistical models and forecasting techniques to understand the future. It involves using data from the past to predict what could happen in the future. This type of analysis is often used in risk assessment, marketing, and sales forecasting.
For example, a company might use predictive analysis to forecast the next quarter’s sales based on historical data.
Prescriptive analysis
Prescriptive analysis is the most advanced type of data analysis. It not only predicts future outcomes but also suggests actions to benefit from these predictions. It uses sophisticated tools and technologies like machine learning and artificial intelligence to recommend decisions.
For example, a prescriptive analysis might suggest the best marketing strategies to increase future sales.
Data Analysis Techniques
There are numerous techniques used in data analysis, each with its unique purpose and application. Here, we will discuss some of the most commonly used techniques, including exploratory analysis, regression analysis, Monte Carlo simulation, factor analysis, cohort analysis, cluster analysis, time series analysis, and sentiment analysis.
Exploratory analysis
Exploratory analysis is used to understand the main characteristics of a data set. It is often used at the beginning of a data analysis process to summarize the main aspects of the data, check for missing data, and test assumptions. This technique involves visual methods such as scatter plots, histograms, and box plots.
You can learn more about exploratory data analysis with our course, covering how to explore, visualize, and extract insights from data using Python.
Regression analysis
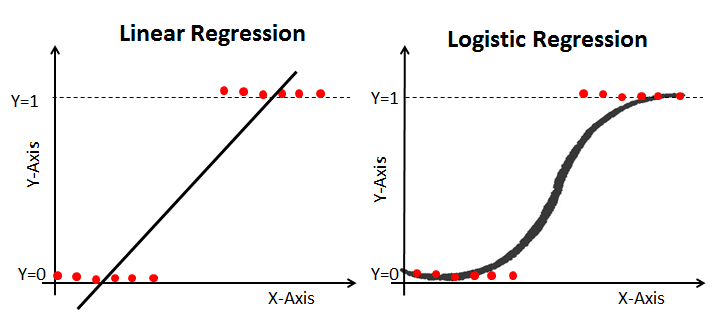
Regression analysis is a statistical method used to understand the relationship between a dependent variable and one or more independent variables. It is commonly used for forecasting, time series modeling, and finding the causal effect relationships between variables.
We have a tutorial exploring the essentials of linear regression, which is one of the most widely used regression algorithms in areas like machine learning.

Linear and logistic regression
Factor analysis
Factor analysis is a technique used to reduce a large number of variables into fewer factors. The factors are constructed in such a way that they capture the maximum possible information from the original variables. This technique is often used in market research, customer segmentation, and image recognition.
Learn more about factor analysis in R with our course, which explores latent variables, such as personality, using exploratory and confirmatory factor analyses.
Data Analysis Tools
In the realm of data analysis, various tools are available that cater to different needs, complexities, and levels of expertise. These tools range from programming languages like Python and R to visualization software like Power BI and Tableau. Let’s delve into some of these tools.
Python
Python is a high-level, general-purpose programming language that has become a favorite among data analysts and data scientists. Its simplicity and readability, coupled with a wide range of libraries like pandas, NumPy, and Matplotlib, make it an excellent tool for data analysis and data visualization.
Resources to get you started
- You can start learning Python today with our Python Fundamentals skill track, which covers all the foundational skills you need to understand the language.
- You can also take out Data Analyst with Python career track to start your journey to becoming a data analyst.
- Check out our Python for beginners cheat sheet as a handy reference guide.
R
R is a programming language and free software environment specifically designed for statistical computing and graphics. It is widely used among statisticians and data miners for developing statistical software and data analysis. R provides a wide variety of statistical and graphical techniques, including linear and nonlinear modeling, classical statistical tests, time-series analysis, and more.


